Gallery / Bars & columns
col
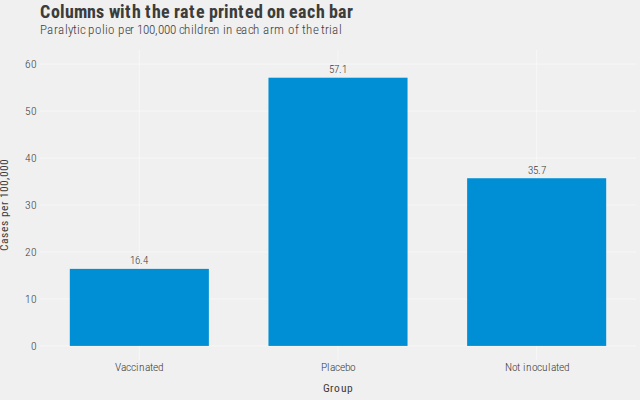
Columns with the rate printed on each bar
Value labels when the exact number is the point of the chart.
Source
Svelte, builder, JSON
<script lang="ts">
  import {
    GeomCol,
    GeomText,
    GGPlot,
    Inspect,
    Labs,
    ScaleXDiscrete,
    ThemeFivethirtyeight,
  } from "@ggts-sh/svelte";

  import { polioTrial } from "./data.js";
</script>

<GGPlot
  data={polioTrial}
  aes={{ x: "group", y: "rate" }}
  width={640}
  height={400}
>
  <GeomCol width={0.7} />
  <GeomText aes={{ label: "label" }} dy={-8} />
  <ScaleXDiscrete domain={["Vaccinated", "Placebo", "Not inoculated"]} />
  <ThemeFivethirtyeight />
  <Labs
    title="Columns with the rate printed on each bar"
    subtitle="Paralytic polio per 100,000 children in each arm of the trial"
    x="Group"
    y="Cases per 100,000"
  />
  <Inspect mode="exact" pin />
</GGPlot>
Meta
Details
- Family
- Bars & columns
- Source
col/value-labels- Rendering
- SVG
- Techniques
Related