Gallery / Statistical summaries
errorbar
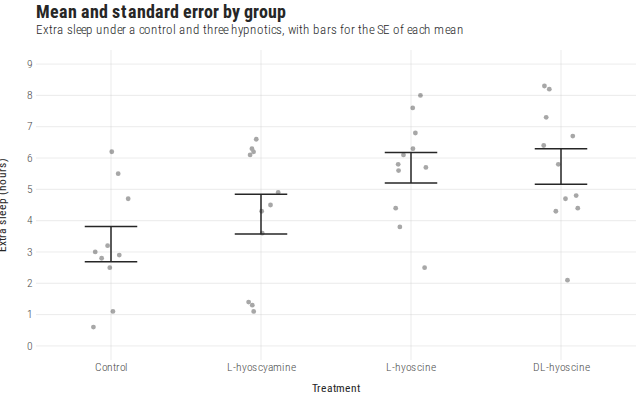
Mean and standard error by group
Mean ± SE for a control and three hypnotic treatments.
Source
Svelte, builder, JSON
<script lang="ts">
  import {
    GeomErrorbar,
    GeomPoint,
    GGPlot,
    Inspect,
    Labs,
    registerSummary,
    ScaleXDiscrete,
    ThemeHrbr,
  } from "@ggts-sh/svelte";

  // stat= override: the shell registers only its default stat (#1420).
  registerSummary();

  import { soporifics } from "./data.js";
</script>

<GGPlot
  data={soporifics}
  aes={{ x: "drug", y: "extraSleep" }}
  width={640}
  height={400}
>
  <GeomPoint
    position="jitter"
    positionParams={{ width: 0.12, height: 0, seed: 7 }}
    alpha={0.4}
    size={2.4}
    inspect={false}
  />
  <GeomErrorbar stat="summary" width={0.35} linewidth={1.5} />
  <ScaleXDiscrete
    domain={["Control", "L-hyoscyamine", "L-hyoscine", "DL-hyoscine"]}
  />
  <ThemeHrbr />
  <Labs
    title="Mean and standard error by group"
    subtitle="Extra sleep under a control and three hypnotics, with bars for the SE of each mean"
    x="Treatment"
    y="Extra sleep (hours)"
  />
  <Inspect mode="exact" pin />
</GGPlot>
Meta
Details
- Family
- Statistical summaries
- Source
errorbar/mean-se- Rendering
- SVG
- Techniques
Related