Gallery / Distributions
histogram
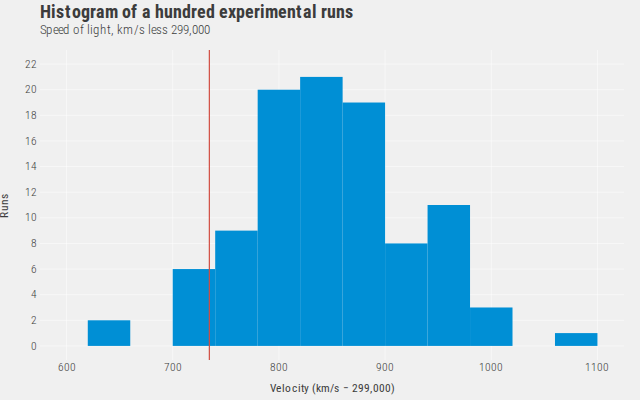
Histogram of a hundred experimental runs
A basic histogram for a single continuous measurement.
Source
Svelte, builder, JSON
<script lang="ts">
  import {
    GeomHistogram,
    GeomRule,
    GGPlot,
    Inspect,
    Labs,
    ThemeFivethirtyeight,
  } from "@ggts-sh/svelte";

  import { michelson } from "./data.js";
</script>

<GGPlot data={michelson} aes={{ x: "velocity" }} width={640} height={400}>
  <GeomHistogram binwidth={40} />
  <GeomRule
    xintercept={734.5}
    linewidth={1.2}
    aes={{ color: { value: "#d14d41" } }}
  />
  <ThemeFivethirtyeight />
  <Labs
    title="Histogram of a hundred experimental runs"
    subtitle="Speed of light, km/s less 299,000"
    x="Velocity (km/s − 299,000)"
    y="Runs"
  />
  <Inspect mode="exact" pin />
</GGPlot>
Meta
Details
- Family
- Distributions
- Source
histogram/basic- Rendering
- SVG
- Techniques
Related