Gallery / Points & scatter
point
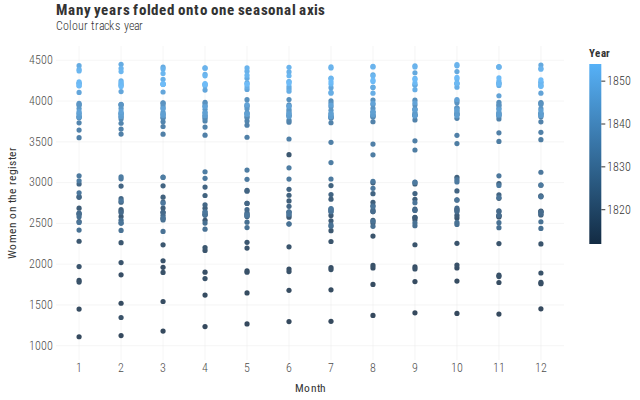
Many years folded onto one seasonal axis
Continuous colour gradients when a third continuous channel carries identity.
Source
Svelte, builder, JSON
<script lang="ts">
  import {
    GeomPoint,
    GGPlot,
    Inspect,
    Labs,
    ScaleColorGradient,
    ScaleXContinuous,
    ThemeMinimal,
  } from "@ggts-sh/svelte";

  import { parisRegister } from "./data.js";
</script>

<GGPlot
  data={parisRegister}
  aes={{ x: "month", y: "registered", color: "year" }}
  width={640}
  height={400}
>
  <GeomPoint size={2.6} alpha={0.85} />
  <ScaleColorGradient low="#132B43" high="#56B1F7" />
  <ScaleXContinuous breaks={[1, 2, 3, 4, 5, 6, 7, 8, 9, 10, 11, 12]} />
  <ThemeMinimal />
  <Labs
    title="Many years folded onto one seasonal axis"
    subtitle="Colour tracks year"
    x="Month"
    y="Women on the register"
    color="Year"
  />
  <Inspect mode="xy" pin maxDistance={24} />
</GGPlot>
Meta
Details
- Family
- Points & scatter
- Source
point/gradient-continuous- Rendering
- SVG
- Techniques
Related