Gallery / Points & scatter
point
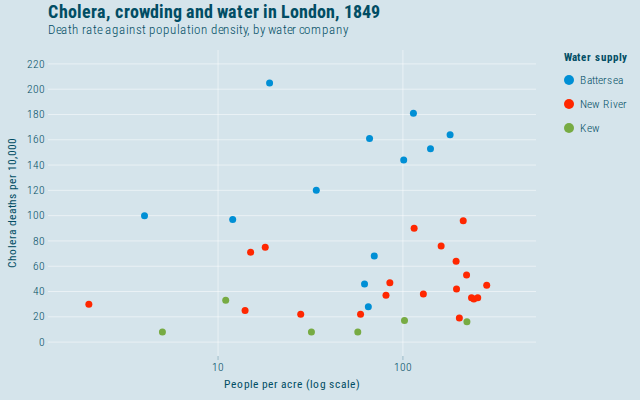
Cholera, crowding and water in London, 1849
Farr's 38 districts: death rate against population density on a log x scale, coloured by which company supplied the water.
Source
Svelte, builder, JSON
<script lang="ts">
  import {
    GeomPoint,
    GGPlot,
    GuideLegend,
    Inspect,
    Labs,
    ScaleColorDiscrete,
    ScaleXLog10,
    ThemeEconomist,
  } from "@ggts-sh/svelte";

  import { londonCholera } from "./data.js";
</script>

<GGPlot
  data={londonCholera}
  aes={{ x: "density", y: "deathRate", color: "water" }}
  width="container"
  height={400}
>
  <GeomPoint size={3.5} />
  <ScaleXLog10 labels="~s" />
  <ScaleColorDiscrete
    domain={["Battersea", "New River", "Kew"]}
    scheme="fivethirtyeight"
  />
  <ThemeEconomist />
  <GuideLegend channel="color" focus />
  <Labs
    title="Cholera, crowding and water in London, 1849"
    subtitle="Death rate against population density, by water company"
    x="People per acre (log scale)"
    y="Cholera deaths per 10,000"
    color="Water supply"
  />
  <Inspect mode="xy" pin identity="district" />
</GGPlot>
Meta
Details
- Family
- Points & scatter
- Source
point/log-scale- Rendering
- SVG
- Techniques
Related