Gallery / Rectangles & grids
tile
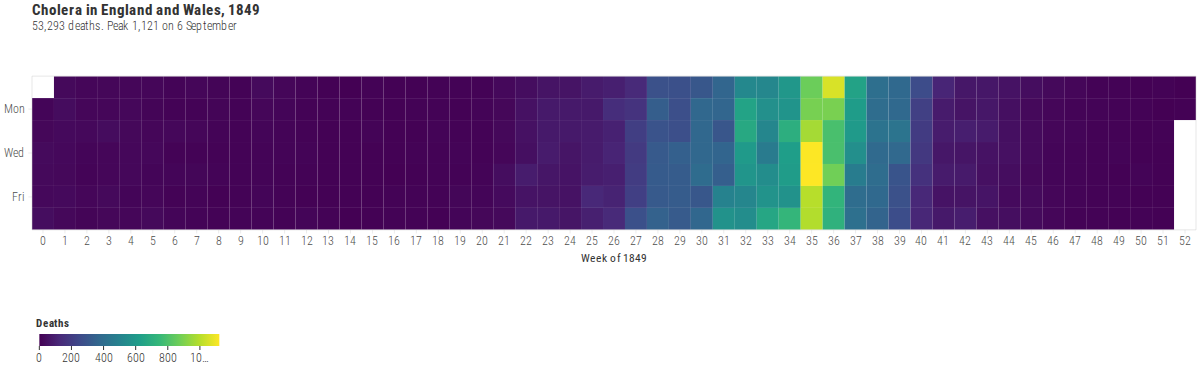
Cholera in England and Wales, 1849
Every day of the epidemic from Farr's weekly returns, laid out as a calendar of square tiles so the summer peak reads as a block.
Source
Svelte, builder, JSON
<script lang="ts">
  import {
    CoordFixed,
    GeomTile,
    GGPlot,
    GuideColorbar,
    Inspect,
    Labs,
    ScaleFillContinuous,
    ScaleXDiscrete,
    ScaleYDiscrete,
    ThemeLight,
  } from "@ggts-sh/svelte";

  import { cholera1849 } from "./data.js";
</script>

<!--
  1200×380 (not the default 640×400): a 53-week × 7-day calendar needs a wide,
  short frame so CoordFixed can keep each band cell square and large enough
  to read. Theme turns grid off so incomplete weeks are real holes.
-->
<GGPlot
  data={cholera1849}
  aes={{ x: "week", y: "weekday", fill: "deaths" }}
  width={1200}
  height={380}
>
  <GeomTile />
  <CoordFixed />
  <ScaleFillContinuous scheme="viridis" />
  <!-- Weeks are numeric but read as a band — one column per week. -->
  <ScaleXDiscrete />
  <!-- Weekday domain reversed so Sunday sits at the top of a calendar. -->
  <ScaleYDiscrete
    domain={["Sat", "Fri", "Thu", "Wed", "Tue", "Mon", "Sun"]}
    breaks={["Mon", "Wed", "Fri"]}
  />
  <ThemeLight grid="none" gridX={false} gridY={false} />
  <GuideColorbar channel="fill" position="bottom" direction="horizontal" />
  <Labs
    title="Cholera in England and Wales, 1849"
    subtitle="53,293 deaths. Peak 1,121 on 6 September"
    x="Week of 1849"
    y=""
    fill="Deaths"
  />
  <Inspect mode="exact" pin />
</GGPlot>
Meta
Details
- Family
- Rectangles & grids
- Source
tile/heatmap- Rendering
- SVG
- Techniques
Related