Gallery / Boxes & distributions
boxplot
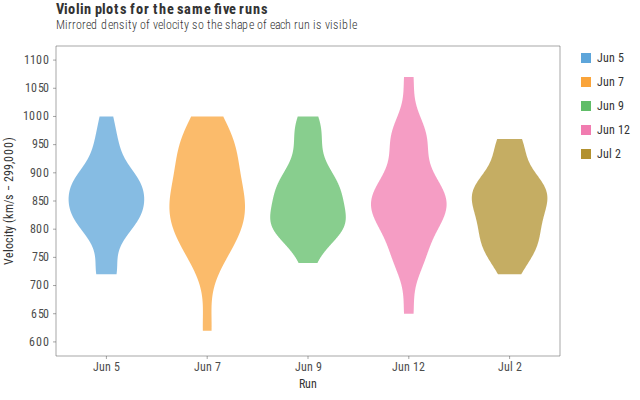
Violin plots for the same five runs
Violins when the full shape of each group matters more than the five-number summary alone.
Source
Svelte, builder, JSON
<script lang="ts">
  import {
    GeomViolin,
    GGPlot,
    Inspect,
    Labs,
    ScaleFillDiscrete,
    ScaleXDiscrete,
    ThemeFew,
  } from "@ggts-sh/svelte";

  import { michelsonRuns } from "../by-category/data.js";
</script>

<GGPlot
  data={michelsonRuns}
  aes={{ x: "run", y: "velocity", fill: "run" }}
  width={640}
  height={400}
>
  <GeomViolin scale="width" trim={true} alpha={0.75} linewidth={0.6} />
  <ScaleXDiscrete domain={["Jun 5", "Jun 7", "Jun 9", "Jun 12", "Jul 2"]} />
  <ScaleFillDiscrete
    domain={["Jun 5", "Jun 7", "Jun 9", "Jun 12", "Jul 2"]}
    scheme="few"
  />
  <ThemeFew />
  <Labs
    title="Violin plots for the same five runs"
    subtitle="Mirrored density of velocity so the shape of each run is visible"
    x="Run"
    y="Velocity (km/s − 299,000)"
    fill=""
  />
  <Inspect mode="exact" pin />
</GGPlot>
Meta
Details
- Family
- Boxes & distributions
- Source
boxplot/violin- Rendering
- SVG
- Techniques
Related