Gallery / Distributions
density
2D density isolines
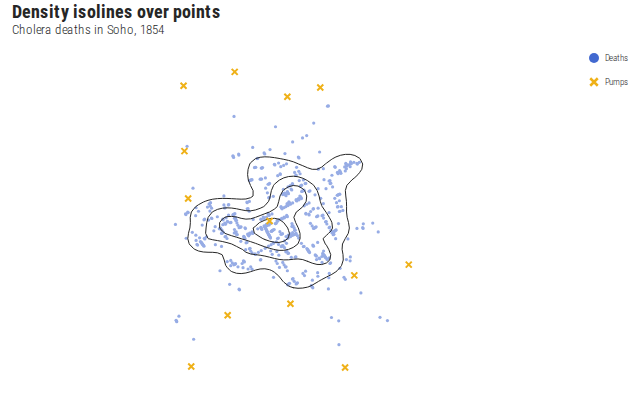
Kernel density drawn as contour lines over 578 point locations. The rings tighten where the points cluster — here, the streets around one pump on Snow's 1854 Soho map.
Source
Svelte, builder, JSON
<script lang="ts">
  import {
    CoordFixed,
    GeomDensity2d,
    GeomPoint,
    GGPlot,
    Inspect,
    Labs,
    ScaleColorDiscrete,
    ThemeMap,
  } from "@ggts-sh/svelte";

  import { choleraDeaths, waterPumps } from "./data.js";
</script>

<GGPlot data={choleraDeaths} aes={{ x: "x", y: "y" }} width={640} height={400}>
  <GeomPoint
    alpha={0.55}
    size={1.6}
    aes={{ color: { value: "Deaths", scale: true } }}
  />
  <GeomDensity2d bins={6} n={48} linewidth={1} />
  <GeomPoint
    data={waterPumps}
    aes={{ x: "x", y: "y", color: { value: "Pumps", scale: true } }}
    size={4}
    shape="cross"
  />
  <ScaleColorDiscrete domain={["Deaths", "Pumps"]} scheme="observable10" />
  <CoordFixed />
  <ThemeMap />
  <Labs
    title="Density isolines over points"
    subtitle="Cholera deaths in Soho, 1854"
    x=""
    y=""
    color=""
  />
  <Inspect mode="xy" pin maxDistance={24} />
</GGPlot>
Meta
Details
- Family
- Distributions
- Source
density/kde-2d- Rendering
- SVG
- Techniques
Related