Gallery / Distributions
density
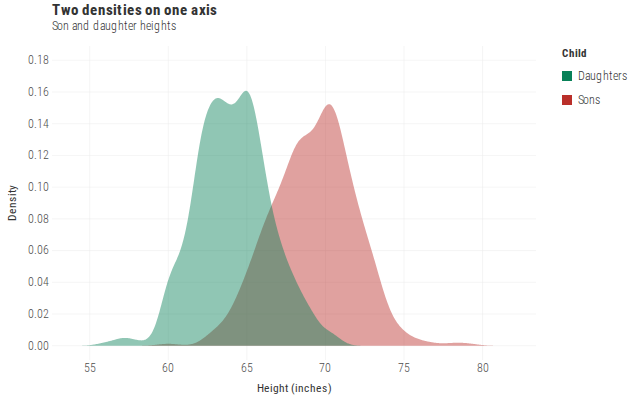
Two densities on one axis
Overlapping density curves for comparing continuous distributions.
Source
Svelte, builder, JSON
<script lang="ts">
  import {
    GeomDensity,
    GGPlot,
    Inspect,
    Labs,
    ScaleFillDiscrete,
    ThemeMinimal,
  } from "@ggts-sh/svelte";

  import { galtonChildren } from "./data.js";
</script>

<GGPlot
  data={galtonChildren}
  aes={{ x: "height", fill: "gender" }}
  width={640}
  height={400}
>
  <GeomDensity alpha={0.45} />
  <ScaleFillDiscrete domain={["Daughters", "Sons"]} scheme="wsj_red_green" />
  <ThemeMinimal />
  <Labs
    title="Two densities on one axis"
    subtitle="Son and daughter heights"
    x="Height (inches)"
    y="Density"
    fill="Child"
  />
  <Inspect mode="x" pin />
</GGPlot>
Meta
Details
- Family
- Distributions
- Source
density/overlay- Rendering
- SVG
- Techniques
Related