Gallery / Maps & polygons
path
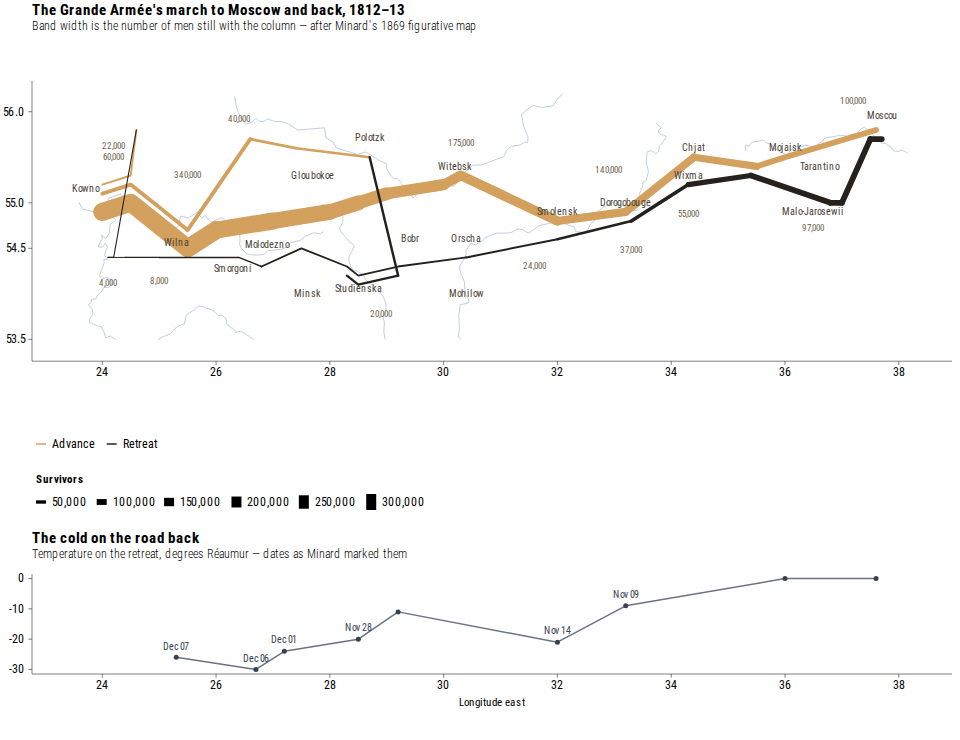
Napoleon's march on Moscow, by Minard
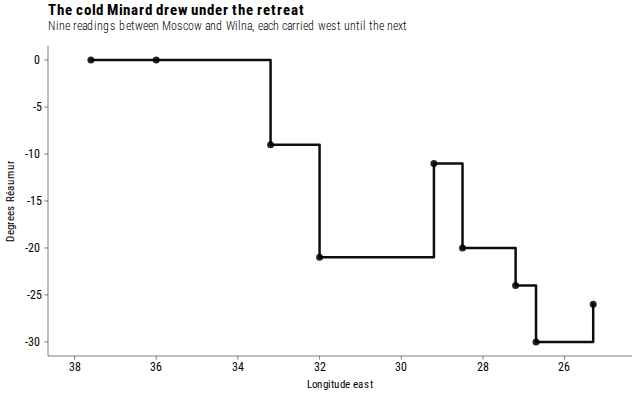
Path map of army strength with a temperature strip.
Source
Svelte, builder, JSON
<script lang="ts">
  import {
    CoordFixed,
    GeomPath,
    GeomPoint,
    GeomText,
    GGPlot,
    Inspect,
    Labs,
    ScaleColorManual,
    ScaleLinewidthContinuous,
    ScaleXContinuous,
    ThemeClassic,
  } from "@ggts-sh/svelte";
  import type { PlotInspectionChange } from "@ggts-sh/svelte";

  import {
    campaignRivers,
    minardCityLabels,
    minardCold,
    minardStrengthLabels,
    minardTroops,
  } from "./data.js";
  import { coldStripTooltipFields, mapMarchTooltipFields } from "./tooltip.js";

  type Inspection = PlotInspectionChange<Record<string, unknown>, PropertyKey>;

  interface AlignmentElements {
    host: HTMLDivElement;
    mapRoot: HTMLElement;
    mapPanel: HTMLElement;
    coldPanel: HTMLElement;
    coldRoot: HTMLElement;
  }

  function alignmentElements(
    host: HTMLDivElement | null,
    map: HTMLDivElement,
    cold: HTMLDivElement,
  ): AlignmentElements | null {
    const mapRoot = map.querySelector(".gg-plot-root");
    const mapPanel = map.querySelector(".gg-panel");
    const coldPanel = cold.querySelector(".gg-panel");
    const coldRoot = cold.querySelector(".gg-plot-root");
    if (
      host === null ||
      mapRoot === null ||
      mapPanel === null ||
      coldPanel === null ||
      coldRoot === null
    ) {
      return null;
    }
    return {
      host,
      mapRoot: mapRoot as HTMLElement,
      mapPanel: mapPanel as HTMLElement,
      coldPanel: coldPanel as HTMLElement,
      coldRoot: coldRoot as HTMLElement,
    };
  }

  /**
   * Map uses CoordFixed; cold strip does not. Independent layout passes then
   * pick different left chrome and, when the map letterboxes, different panel
   * widths — shared lon limits stop lining up. After both plots paint, pin the
   * cold host so its data panel matches the map panel.
   *
   * Observe the *map* only. Resizing the cold host used to re-enter align
   * (ResizeObserver + style MutationObserver), which recomputed width from the
   * new cold margins and oscillated forever on the right edge.
   */
  let minardEl = $state<HTMLDivElement | null>(null);
  let mapHost = $state<HTMLDivElement | null>(null);
  let coldHost = $state<HTMLDivElement | null>(null);
  let coldShiftPx = $state(0);
  let coldWidthPx = $state<number | null>(null);
  /** Cold plot chrome sampled once per map-root width (not every cold reflow). */
  let frozenColdLeftMargin: number | null = null;
  let frozenColdRightMargin: number | null = null;
  let frozenForMapRootWidth = -1;

  $effect(() => {
    const map = mapHost;
    const cold = coldHost;
    if (map === null || cold === null) return;

    let raf = 0;
    let alive = true;
    const schedule = (): void => {
      cancelAnimationFrame(raf);
      raf = requestAnimationFrame(() => {
        if (!alive) return;
        alignColdPanelToMap(schedule);
      });
    };

    function alignColdPanelToMap(reschedule: () => void): void {
      const elements = alignmentElements(minardEl, map, cold);
      if (elements === null) return;
      const { host, mapRoot, mapPanel, coldPanel, coldRoot } = elements;
      if (
        mapRoot.dataset["ggReady"] !== "true" ||
        coldRoot.dataset["ggReady"] !== "true"
      ) {
        return;
      }

      const hostBox = host.getBoundingClientRect();
      const mapRootBox = mapRoot.getBoundingClientRect();
      const mapPanelBox = mapPanel.getBoundingClientRect();
      if (mapPanelBox.width < 8 || mapRootBox.width < 8) return;

      const mapRootWidth = Math.round(mapRootBox.width);
      // Container width changed: drop the pin, sample chrome at full width next frame.
      if (frozenForMapRootWidth !== mapRootWidth && coldWidthPx !== null) {
        frozenColdLeftMargin = null;
        frozenColdRightMargin = null;
        frozenForMapRootWidth = mapRootWidth;
        coldWidthPx = null;
        coldShiftPx = 0;
        // Tracked via schedule() so effect cleanup cancels this rAF on unmount.
        reschedule();
        return;
      }
      frozenForMapRootWidth = mapRootWidth;

      // Sample cold left/right chrome once per container width, while the strip
      // is still full-bleed — never after our pin reflow (that caused right-edge
      // width oscillation). Measure against the <svg>, not .gg-plot-root: after
      // unpin the root is already 100% wide while the SVG may still hold the
      // previous scene width until GGPlot's own ResizeObserver rAF commits.
      if (frozenColdLeftMargin === null || frozenColdRightMargin === null) {
        const coldSvg = coldRoot.querySelector("svg");
        if (coldSvg === null) return;
        const coldPanelBox = coldPanel.getBoundingClientRect();
        const coldSvgBox = coldSvg.getBoundingClientRect();
        const coldRootBox = coldRoot.getBoundingClientRect();
        if (coldPanelBox.width < 8 || coldSvgBox.width < 8) return;
        // Wait until the plot has remeasured to the host (full-bleed after unpin).
        if (Math.abs(coldSvgBox.width - coldRootBox.width) > 2) {
          reschedule();
          return;
        }
        frozenColdLeftMargin = coldPanelBox.left - coldSvgBox.left;
        frozenColdRightMargin = coldSvgBox.right - coldPanelBox.right;
      }

      const nextWidth = Math.round(
        mapPanelBox.width + frozenColdLeftMargin + frozenColdRightMargin,
      );
      const nextShift = Math.round(
        mapPanelBox.left - hostBox.left - frozenColdLeftMargin,
      );
      if (
        !Number.isFinite(nextWidth) ||
        !Number.isFinite(nextShift) ||
        nextWidth < 32
      ) {
        return;
      }
      if (coldWidthPx === nextWidth && coldShiftPx === nextShift) return;
      coldWidthPx = nextWidth;
      coldShiftPx = nextShift;
    }

    // Map size / letterbox is the source of truth. Do not observe cold: writing
    // coldWidthPx/coldShiftPx resizes cold and would re-enter align forever.
    const ro = new ResizeObserver(schedule);
    ro.observe(map);
    if (minardEl !== null) ro.observe(minardEl);

    const mo = new MutationObserver(schedule);
    mo.observe(map, {
      attributes: true,
      attributeFilter: ["data-gg-ready"],
      subtree: true,
      childList: true,
    });
    mo.observe(cold, {
      attributes: true,
      attributeFilter: ["data-gg-ready"],
      subtree: true,
      childList: true,
    });

    schedule();
    return () => {
      alive = false;
      cancelAnimationFrame(raf);
      ro.disconnect();
      mo.disconnect();
    };
  });
</script>

{#snippet tip(fields: { label: string; value: string }[])}
  {#if fields.length > 0}
    <dl class="minard-tip">
      {#each fields as field (field.label)}
        <div>
          <dt>{field.label}</dt>
          <dd>{field.value}</dd>
        </div>
      {/each}
    </dl>
  {/if}
{/snippet}

{#snippet mapTooltip(inspection: Inspection)}
  {@render tip(mapMarchTooltipFields(inspection.focus.row ?? {}))}
{/snippet}

{#snippet coldTooltip(inspection: Inspection)}
  {@render tip(coldStripTooltipFields(inspection.focus.row ?? {}))}
{/snippet}

<div class="minard" bind:this={minardEl}>
  <div class="minard-map" bind:this={mapHost}>
    <GGPlot width="container" height={520}>
      <GeomPath
        data={campaignRivers}
        aes={{
          x: "long",
          y: "lat",
          group: "river",
          color: { value: "#8fa8c0" },
        }}
        linewidth={0.8}
        alpha={0.7}
        inspect={false}
      />
      <GeomPath
        data={minardTroops}
        aes={{
          x: "long",
          y: "lat",
          group: "leg",
          color: "direction",
          linewidth: "survivors",
        }}
      />
      <GeomText
        data={minardCityLabels}
        aes={{ x: "lx", y: "ly", label: "city", color: { value: "#4a4237" } }}
        size={10}
        dy={-9}
        inspect={false}
      />
      <GeomText
        data={minardStrengthLabels}
        aes={{
          x: "long",
          y: "lat",
          label: "count",
          color: { value: "#6b5d4a" },
        }}
        size={9}
        inspect={false}
      />
      <!-- lon/lat degrees are not the same length on the ground at 55°N -->
      <CoordFixed ratio={1.6} />
      <ScaleXContinuous limits={[23.5, 38.2]} />
      <!-- legends below the panel so side legends do not steal panel width -->
      <ScaleColorManual
        domain={["Advance", "Retreat"]}
        values={["#d3a05e", "#25221e"]}
        guide={{ type: "legend", position: "bottom" }}
      />
      <ScaleLinewidthContinuous
        range={[1, 18]}
        guide={{ type: "legend", position: "bottom" }}
      />
      <ThemeClassic />
      <Labs
        title="The Grande Armée's march to Moscow and back, 1812–13"
        subtitle="Band width is the number of men still with the column — after Minard's 1869 figurative map"
        x=""
        y=""
        color=""
        linewidth="Survivors"
      />
      <Inspect mode="xy" pin maxDistance={24} content={mapTooltip} />
    </GGPlot>
  </div>

  <!--
    Units live in the subtitle so both plots omit a y-axis title band.
    Host size/offset is rewritten to the map data panel after paint (see script).
  -->
  <div
    class="minard-cold"
    bind:this={coldHost}
    style:margin-left={coldWidthPx === null
      ? undefined
      : `${String(coldShiftPx)}px`}
    style:width={coldWidthPx === null ? "100%" : `${String(coldWidthPx)}px`}
  >
    <GGPlot data={minardCold} width="container" height={190}>
      <GeomPath
        aes={{ x: "long", y: "temp", color: { value: "#6b7280" } }}
        linewidth={1.5}
      />
      <GeomPoint
        aes={{ x: "long", y: "temp", color: { value: "#374151" } }}
        size={2.5}
      />
      <GeomText
        aes={{
          x: "long",
          y: "temp",
          label: "date",
          color: { value: "#374151" },
        }}
        size={10}
        dy={-11}
        inspect={false}
      />
      <ScaleXContinuous limits={[23.5, 38.2]} />
      <ThemeClassic />
      <Labs
        title="The cold on the road back"
        subtitle="Temperature on the retreat, degrees Réaumur — dates as Minard marked them"
        x="Longitude east"
        y=""
      />
      <Inspect mode="xy" pin maxDistance={24} content={coldTooltip} />
    </GGPlot>
  </div>
</div>

<style>
  .minard {
    display: flex;
    flex-direction: column;
    gap: 0.5rem;
    /* fullWidth frame + container-width plots: fill the shell so live
       matches the stretched gallery PNG instead of snapping to a fixed px. */
    width: 100%;
    min-width: 0;
  }

  .minard-map,
  .minard-cold {
    min-width: 0;
    box-sizing: border-box;
  }

  .minard-map {
    width: 100%;
  }

  .minard-tip {
    margin: 0;
    display: grid;
    gap: 0.2rem;
    font: 0.8rem/1.3 var(--gg-font-family, system-ui, sans-serif);
  }

  .minard-tip div {
    display: grid;
    grid-template-columns: auto 1fr;
    gap: 0.35rem 0.65rem;
    align-items: baseline;
  }

  .minard-tip dt {
    margin: 0;
    color: var(--muted, #59636e);
    font-weight: 600;
  }

  .minard-tip dd {
    margin: 0;
    color: var(--fg, #17202a);
  }
</style>
Meta
Details
- Family
- Maps & polygons
- Source
path/trajectory- Rendering
- SVG
- Techniques
Related