Gallery / Areas
area
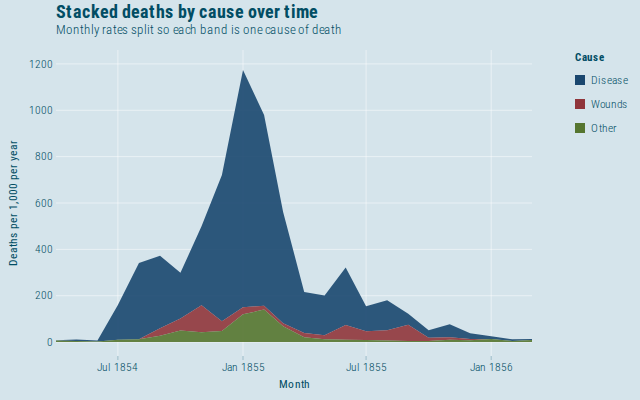
Stacked deaths by cause over time
Stacked areas for parts of a whole that change over time.
Source
Svelte, builder, JSON
<script lang="ts">
  import {
    GeomArea,
    GGPlot,
    GuideLegend,
    Inspect,
    Labs,
    ScaleFillDiscrete,
    ScaleXDate,
    ThemeEconomist,
  } from "@ggts-sh/svelte";

  import { crimeanMortality } from "./data.js";
</script>

<GGPlot
  data={crimeanMortality}
  aes={{ x: "month", y: "deaths", fill: "cause" }}
  width={640}
  height={400}
>
  <GeomArea alpha={0.9} />
  <ScaleXDate labels="%b %Y" />
  <ScaleFillDiscrete domain={["Disease", "Wounds", "Other"]} scheme="stata" />
  <ThemeEconomist />
  <GuideLegend channel="fill" focus />
  <Labs
    title="Stacked deaths by cause over time"
    subtitle="Monthly rates split so each band is one cause of death"
    x="Month"
    y="Deaths per 1,000 per year"
    fill="Cause"
  />
  <Inspect mode="x" pin />
</GGPlot>
Meta
Details
- Family
- Areas
- Source
area/stacked- Rendering
- SVG
- Techniques
Related