Gallery / Bars & columns
bar
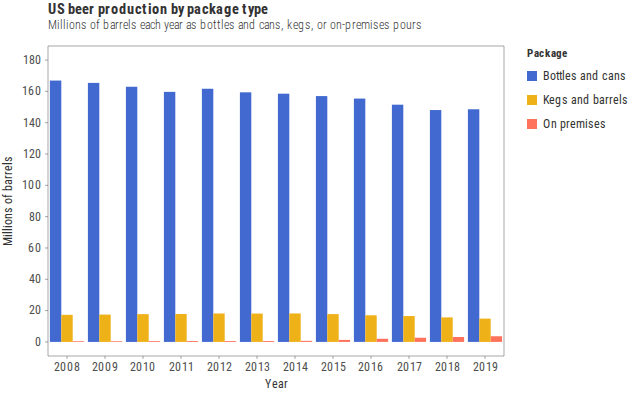
US beer production by package type
Dodged bars of national production by year and package.
Source
Svelte, builder, JSON
<script lang="ts">
  import {
    GeomBar,
    GGPlot,
    GuideLegend,
    Inspect,
    Labs,
    ScaleFillDiscrete,
    ThemeFew,
  } from "@ggts-sh/svelte";

  import { beerProduction } from "./data.js";
</script>

<GGPlot
  data={beerProduction}
  aes={{ x: "year", fill: "package", weight: "barrelsMillions" }}
  width={640}
  height={400}
>
  <GeomBar position="dodge" />
  <ScaleFillDiscrete scheme="observable10" />
  <ThemeFew />
  <GuideLegend channel="fill" focus />
  <Labs
    title="US beer production by package type"
    subtitle="Millions of barrels each year as bottles and cans, kegs, or on-premises pours"
    x="Year"
    y="Millions of barrels"
    fill="Package"
  />
  <Inspect mode="exact" pin />
</GGPlot>
Meta
Details
- Family
- Bars & columns
- Source
bar/dodged- Rendering
- SVG
- Techniques
Related