Gallery / Lines & time
line
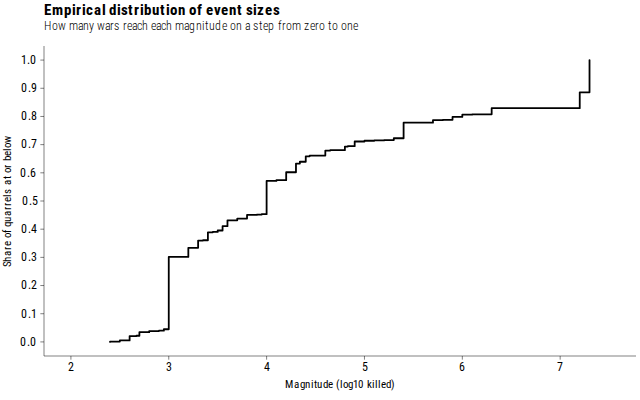
Empirical distribution of event sizes
ECDF lines for the cumulative share of observations at or below each value.
Source
Svelte, builder, JSON
<script lang="ts">
  import {
    GeomLine,
    GGPlot,
    Inspect,
    Labs,
    registerEcdf,
    ThemeClassic,
  } from "@ggts-sh/svelte";

  // stat= override: the shell registers only its default stat (#1420).
  registerEcdf();

  import { deadlyQuarrels } from "./data.js";
</script>

<GGPlot data={deadlyQuarrels} aes={{ x: "magnitude" }} width={640} height={400}>
  <GeomLine stat="ecdf" curve="step-hv" linewidth={1.8} pad={true} />
  <ThemeClassic />
  <Labs
    title="Empirical distribution of event sizes"
    subtitle="How many wars reach each magnitude on a step from zero to one"
    x="Magnitude (log10 killed)"
    y="Share of quarrels at or below"
  />
  <Inspect mode="x" pin />
</GGPlot>
Meta
Details
- Family
- Lines & time
- Source
line/ecdf- Rendering
- SVG
- Techniques
Related