Gallery / Lines & rules
line
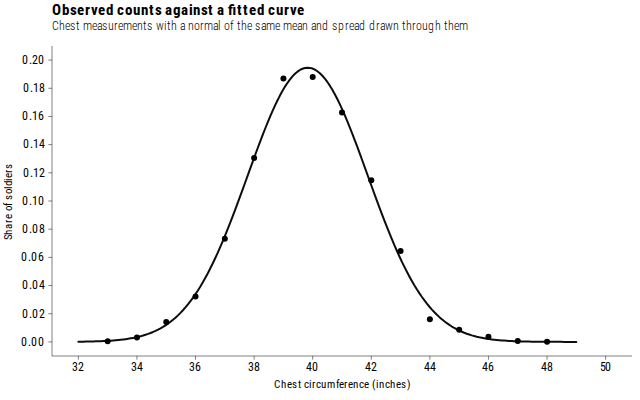
Observed counts against a fitted curve
Function lines when theory (or a fit) should sit on top of the data.
Source
Svelte, builder, JSON
<script lang="ts">
  import {
    GeomFunction,
    GeomPoint,
    GGPlot,
    Inspect,
    Labs,
    ThemeClassic,
  } from "@ggts-sh/svelte";

  import { chestSizes } from "./data.js";
</script>

<GGPlot data={chestSizes} aes={{ x: "chest" }} width={640} height={400}>
  <GeomPoint aes={{ y: "share" }} size={3} />
  <GeomFunction
    fun="dnorm"
    n={201}
    xlim={[32, 49]}
    args={{ mean: 39.83, sd: 2.05 }}
    linewidth={2}
    alpha={0.95}
  />
  <ThemeClassic />
  <Labs
    title="Observed counts against a fitted curve"
    subtitle="Chest measurements with a normal of the same mean and spread drawn through them"
    x="Chest circumference (inches)"
    y="Share of soldiers"
  />
  <Inspect mode="x" pin />
</GGPlot>
Meta
Details
- Family
- Lines & rules
- Source
line/function- Rendering
- SVG
- Techniques
Related