Gallery / Rectangles & grids
raster
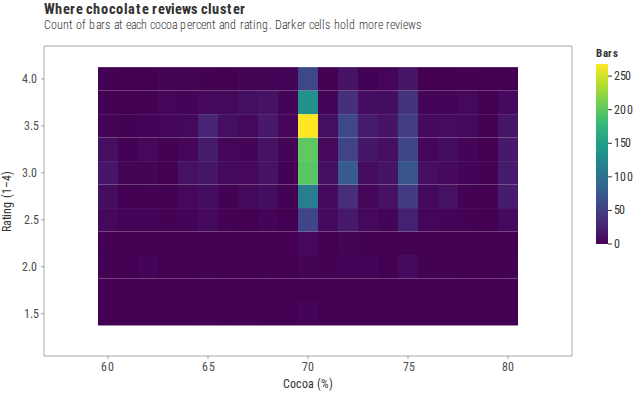
Where chocolate reviews cluster
A complete cocoa-percent × rating grid of bar counts. Use a raster when your table is already a regular grid of fill values.
Source
Svelte, builder, JSON
<script lang="ts">
  import {
    GeomRaster,
    GGPlot,
    Inspect,
    Labs,
    ScaleFillContinuous,
    ThemeFew,
  } from "@ggts-sh/svelte";

  import { chocolateRatingGrid } from "./data.js";
</script>

<GGPlot
  data={chocolateRatingGrid}
  aes={{ x: "cocoaPercent", y: "rating", fill: "bars" }}
  width={640}
  height={400}
>
  <GeomRaster />
  <ScaleFillContinuous scheme="viridis" />
  <ThemeFew />
  <Labs
    title="Where chocolate reviews cluster"
    subtitle="Count of bars at each cocoa percent and rating. Darker cells hold more reviews"
    x="Cocoa (%)"
    y="Rating (1–4)"
    fill="Bars"
  />
  <Inspect mode="exact" pin />
</GGPlot>
Meta
Details
- Family
- Rectangles & grids
- Source
raster/grid- Rendering
- SVG
- Techniques
Related